Conway’s game of life is a simple simulation where patterns are made on a grid, with generations of squares appearing, surviving and disappearing (“dying”) based on simple rules. We will code the basic simulation in Python and then see how we can expand and change the rules to imitate real life processes.
Rules: Original Conway’s game of life
The original rules for what happens to a cell in the grid in the next generation are as follows:
- A live cell dies if it is surrounded by less than 2 live cells (“underpopulation”)
- A live cell survives if it is surrounded by 2 or 3 live cells
- A live cell dies if it is surrounded by more than 3 live cells (“overpopulation”)
- A dead cell becomes live if surrounded by exactly 3 live cells (“production”)
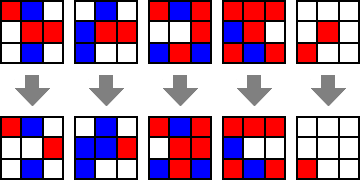
The following gives examples of what happens to a particular square (blue) in different neighborhood scenarios.

And that’s it! Very simple rules but Conway’s game of life has been subject of much research since it’s conception.
The patterns and behaviours that are observed are entirely dependent on the initial configuration of dead and live cells on the grid, leading to interesting and often chaotic patterns, even between very similar looking starting configurations.
Coding it up
I use the PyGame module (see the abundance of support online for installing/ information on it) to handle the visual side of things. Indeed, most of the code that follows actually only concerns printing the simulation to the screen; the actual logic of the simulation is straightforward.
The following is the main method for displaying the current generation’s grid to the screen.
import pygame, sys, time
from pygame.locals import *
from PIL import Image

pygame.init()
WHITE = (255, 255, 255)
BLACK = (0, 0, 0)
WINDOWWIDTH = 800
WINDOWHEIGHT = 800
GRIDWIDTH = 100
GRIDHEIGHT = 100
RW = WINDOWWIDTH / GRIDWIDTH
RH = WINDOWHEIGHT / GRIDHEIGHT
DISPLAYSURF = pygame.display.set_mode((WINDOWWIDTH, WINDOWHEIGHT))
currentGrid = initialConfiguration(GRIDWIDTH, GRIDHEIGHT)
playing = True

while playing:
    for event in pygame.event.get():
        if event.type == QUIT:
            pygame.quit()
            sys.exit()
    currentGrid = tick(currentGrid)
    DISPLAYSURF.fill(WHITE)
    for x in range(GRIDWIDTH):
        for y in range(GRIDHEIGHT):
            if currentGrid[x][y] == 1:
                pygame.draw.rect(DISPLAYSURF, BLACK, (x*RW, y*RH, RW, RH))
    time.sleep(0.05)
The only things left to do are to define “initialConfiguration”, which is where we can input our desired starting pattern and “tick()” function, which updates the simulation to the next generation.
Inputting initial configurations manually takes ages. We will allow ourselves to create visual patterns and read them in using “pillow” or “PIL” module in python. The idea is that we can draw an image, save it and let the program read in each pixel, making any pixel we drew in black into a live cell.
def initialConfiguration():
    path = 'C:\\Users\\\\Documents\\'
    gridImage = Image.open(path+'gridImage.png', 'r')
    pix = gridImage.load()
    grid = [[0]*GRIDWIDTH for i in range(GRIDHEIGHT)]
    for x in range(GRIDWIDTH):
        for y in range(GRIDHEIGHT):
            if pix[x, y] == BLACK:
                grid[x][y] = 1
            else:
                grid[x][y] = 0
    return grid
Make sure to change the path/ image file to wherever you save and call the image file. The image also has to have the dimensions (GRIDWIDTH, GRIDHEIGHT) e.g in our scenario the image is 100 x 100. Also make sure to save the picture as a png and also 24 bit. For larger images I got an annoying error where Paint.net would automatically save it in a different format meaning the colors were no longer recognised by the Python program.
Finally, tick() counts live neighbours around each cell and implements Conway’s rules to decide if the cell lives or dies next generation. It then returns the new grid to be printed to the screen.
def tick(oldGrid):
    newGrid = [[0]*GRIDWIDTH for i in range(GRIDHEIGHT)]
    for x in range(1,GRIDWIDTH-1):
        for y in range(1,GRIDHEIGHT-1):
            newGrid[x][y] = oldGrid[x][y]
            neighbours = 0
            if oldGrid[x-1][y-1] == 1:
                neighbours += 1
            if oldGrid[x][y-1] == 1:
                neighbours += 1
            if oldGrid[x+1][y-1] == 1:
                neighbours += 1
            if oldGrid[x+1][y] == 1:
                neighbours += 1
            if oldGrid[x+1][y+1] == 1:
                neighbours += 1
            if oldGrid[x][y+1] == 1:
                neighbours += 1
            if oldGrid[x-1][y+1] == 1:
                neighbours += 1
            if oldGrid[x-1][y] == 1:
                neighbours += 1

            if oldGrid[x][y] == 1:
                if neighbours == 2 or neighbours == 3:
                    newGrid[x][y] = 1
                else:
                    newGrid[x][y] = 0
            elif neighbours == 3:
                newGrid[x][y] = 1
            else:
                newGrid[x][y] = 0
    return newGrid
And that’s all you need. Try out some different starting configurations and you may see particular cycles of shapes that researches have identified and named (see any source on Conway’s game of life for more info on these).
A good one to draw is Gosper’s glider gun, which spawns “gliders” which travel off indefinitely.

Modelling an invasion simulation
We can start thinking about how one may adapt these basic rules to analyse and model new systems.
For example, we can model two opposing populations, (“red” and “blue” say) where the presence of one species eliminates the other. You can imagine the uses for this type of thinking in opposing sides of a war or invasions and spread of tribes or even disease.
Rules
We are flexible to decide on some intuitive rules for our new game, where we are aiming to model invasions. Let’s suggest the following, in order of priority:
- If a cell is surrounded by equal numbers of red and blue cells, the cell dies no matter what (there’s conflict, it’s a no man’s land, there’s no overall red or blue majority to support it).
- If a cell has a red/blue majority with 2-4 of that color, the cell turns red/blue
- If a cell has a red/blue majority with greater than 4 of that color, the cell dies (overpopulation)
- If a cell has only one red or blue neighbour, it dies (underpopulation)
Here’s some example neighbourhood scenarios:

Changes to the code
def tick(oldGrid):
    newGrid = [[0]*GRIDWIDTH for i in range(GRIDHEIGHT)]
    for x in range(1,GRIDWIDTH-1):
        for y in range(1,GRIDHEIGHT-1):
            newGrid[x][y] = oldGrid[x][y]
            reds = 0
            blues = 0
            if oldGrid[x-1][y-1] == 1:
                reds += 1
            elif oldGrid[x-1][y-1] == 2:
                blues += 1
            if oldGrid[x][y-1] == 1:
                reds += 1
            elif oldGrid[x][y-1] == 2:
                blues += 1
            if oldGrid[x+1][y-1] == 1:
                reds += 1
            elif oldGrid[x+1][y-1] == 2:
                blues += 1
            if oldGrid[x+1][y] == 1:
                reds += 1
            elif oldGrid[x+1][y] == 2:
                blues += 1
            if oldGrid[x+1][y+1] == 1:
                reds += 1
            elif oldGrid[x+1][y+1] == 2:
                blues += 1
            if oldGrid[x][y+1] == 1:
                reds += 1
            elif oldGrid[x][y+1] == 2:
                blues += 1
            if oldGrid[x-1][y+1] == 1:
                reds += 1
            elif oldGrid[x-1][y+1] == 2:
                blues += 1
            if oldGrid[x-1][y] == 1:
                reds += 1
            elif oldGrid[x-1][y] == 2:
                blues += 1

            if reds == blues:
                newGrid[x][y] = 0
            elif reds > blues and reds in range(2, 4):
                newGrid[x][y] = 1
            elif blues > reds and blues in range(2, 4):
                newGrid[x][y] = 2
            elif (reds > blues and reds > 4) or (blues > reds and blues > 4):
                newGrid[x][y] = 0
            else:
                newGrid[x][y] = 0
    return newGrid
New pattern display code:
while playing:
.....
    for x in range(GRIDWIDTH):
        for y in range(GRIDHEIGHT):
            if currentGrid[x][y] == 1:
                pygame.draw.rect(DISPLAYSURF, RED, (x*RW, y*RH, RW, RH))
            elif currentGrid[x][y] == 2:
                pygame.draw.rect(DISPLAYSURF, BLUE, (x*RW, y*RH, RW, RH))
Example simulation
Lets try a starting scenario!

We’ve got an inner lining of 20 blue surrounded by 160 red. Will the blue be able to survive?
On generation 5, 16 blue still exist but surrounded by the growing 300 reds.

By generation 21 the blue centre have upped their numbers to a whopping 100 despite being surrounded by red. It’s easy to conclude that the blue will be able to survive indefinitely in the centre. …….surely?

What happens in the very next generation: 22?

The dense overcrowding of blue surrounded by closely packed reds actually causes extinction!
Head over to the next blog post where I’ll look less at the code and more at similar interesting results and tweaks to this simulation.


You can certainly see your skills in the work you write. The sector hopes for even more passionate writers such as you who aren’t afraid to mention how they believe. All the time follow your heart.
LikeLike